National News Release: Study confirms age of oldest fossil human footprints in North America
Two new lines of evidence support the 21,000 to 23,000-year age estimate of the footprints first described and dated in 2021
What's it like to be a Climate Research and Development scientist?
Check out our "Day in the Life" video!
Featured Story
USGS looks back 2,000 years to study the relationship between hurricanes and climate
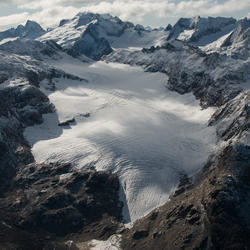
The Glacier - Climate Connection
The story of the U.S. Geological Survey Benchmark Glacier Project, one of the longest running studies of glaciers on Earth
The National Climate Change Viewer (NCCV)
A tool that helps land managers and decision makers plan for climate change
Climate Research and Development Program
The Climate Research and Development (Climate R&D) Program strives to advance the understanding of the physical, chemical, and biological components of the Earth system, the causes and consequences of climate and land use change, and the vulnerability and resilience of the Earth system to such changes.
Quick Links
Climate history, land cover and land surface data and models are vital for assessing the impacts of climate change, evaluating ecosystem status and health, understanding spatial patterns of biodiversity, and informing land use planning.


