
National News Release: Study confirms age of oldest fossil human footprints in North America
Two new lines of evidence support the 21,000 to 23,000-year age estimate of the footprints first described and dated in 2021
Two new lines of evidence support the 21,000 to 23,000-year age estimate of the footprints first described and dated in 2021
What's it like to be a Climate Research and Development scientist?
Check out our "Day in the Life" video!
Check out our "Day in the Life" video!
Featured Story
USGS looks back 2,000 years to study the relationship between hurricanes and climate
USGS looks back 2,000 years to study the relationship between hurricanes and climate
The Glacier - Climate Connection
The story of the U.S. Geological Survey Benchmark Glacier Project, one of the longest running studies of glaciers on Earth
The story of the U.S. Geological Survey Benchmark Glacier Project, one of the longest running studies of glaciers on Earth
The National Climate Change Viewer (NCCV)
A tool that helps land managers and decision makers plan for climate change
A tool that helps land managers and decision makers plan for climate change
Climate Research and Development Program
The Climate Research and Development (Climate R&D) Program strives to advance the understanding of the physical, chemical, and biological components of the Earth system, the causes and consequences of climate and land use change, and the vulnerability and resilience of the Earth system to such changes.


Quick Links
Quick Links
Climate history, land cover and land surface data and models are vital for assessing the impacts of climate change, evaluating ecosystem status and health, understanding spatial patterns of biodiversity, and informing land use planning.
News
In monarch butterfly decline mystery, scientists rule out habitat loss in migration zone
In monarch butterfly decline mystery, scientists rule out habitat loss in migration zone
President proposes $1.6 billion FY 2025 budget for USGS
President proposes $1.6 billion FY 2025 budget for USGS
Publications
Polar paleoenvironmental perspectives on modern climate change
In today’s rapidly changing climate, society needs a better understanding of climate impacts on sea level, ice sheets and glaciers, sea ice, ocean circulation, ecosystems, biodiversity, and other aspects of planet Earth. Paleoenvironmental records provide a unique and invaluable source of insight into these complex issues, and place recent observations into a broader historical context. This essay
Aquatic carbon export and dynamics in mountain headwater streams of the western U.S.
Mountain headwater streams actively cycle carbon, receiving it from terrestrial landscapes and exporting it through downstream transport and gas exchange with the atmosphere. Although their importance is now widely recognized, aquatic carbon fluxes in headwater streams remain poorly characterized. In this study, aquatic carbon fluxes were measured in 15 mountain headwater streams and were used in
Vegetation change over 140 years in a sagebrush landscape of the Rio Grande del Norte National Monument, New Mexico, USA
QuestionsBig sagebrush (Artemisia tridentata) ecosystems across the western United States have experienced many changes in ecosystem dynamics and vegetation composition over the last century due to livestock grazing, non-native species, and changing climate and fire regimes. We conducted the first systematic investigation of historical vegetation composition and vegetation change in a sagebrush la
Science
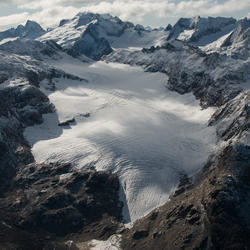
South Cascade Glacier
South Cascade Glacier is located in the midlatitude maritime climate of the North Cascade Mountains of Washington State. Glacier observations began at this site in 1958.
Lemon Creek Glacier
Lemon Creek Glacier is located in the high-latitude maritime region of Alaska, at the southernmost tip of the Juneau Icefield. Glacier observations began at this site in 1953.

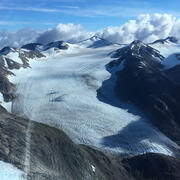
Gulkana Glacier
Gulkana Glacier is located in the high-latitude continental climate regime of Alaska’s Delta Mountains. Glacier observations began at this site in 1966.